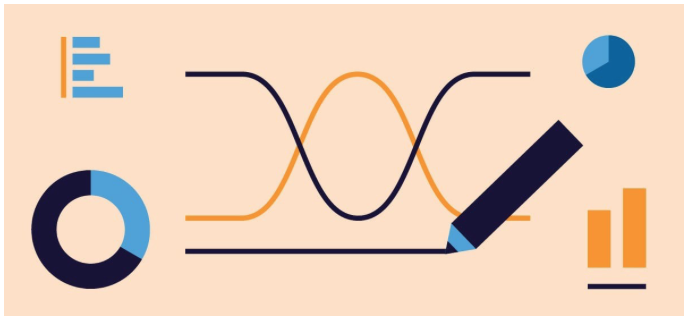
ARTICLE SUMMERY: The importance of Data Visualization can not be understated. In “How to Master Data Visualization” Lucy Todd covers the many ways to display the information you want to convey to your clients targeted audience, such as
- Bar graphs
- Line graphs
- Pie and donut charts (circle charts)
- Quantagrams
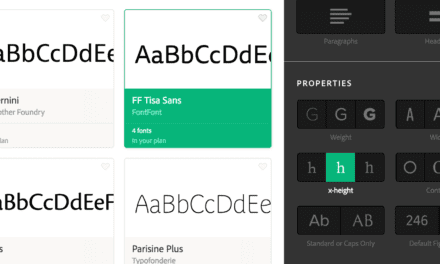
- Typography
Lucy Todd states “the choice of what type of visualization to use isn’t purely aesthetic, nor is it entirely personal. The wrong choice can lead your viewer to boredom, confusion, or both. Even worse, visualizing data inaccurately can constitute a breach of trust between you and your audience.”, this article will help you determine what you should use to achieve this goal.
Please share your thoughts in the comment section.


