
ARTICLE SUMMARY: Data visualization is becoming the preferred way to present large amounts of data in a clear and concise manner.
Data visualization helps in presenting complex datasets in a visual format that is quick and easy to understand. Charts, graphs, and maps make it simpler for individuals to grasp patterns, trends, and insights that may be challenging to interpret from raw data.
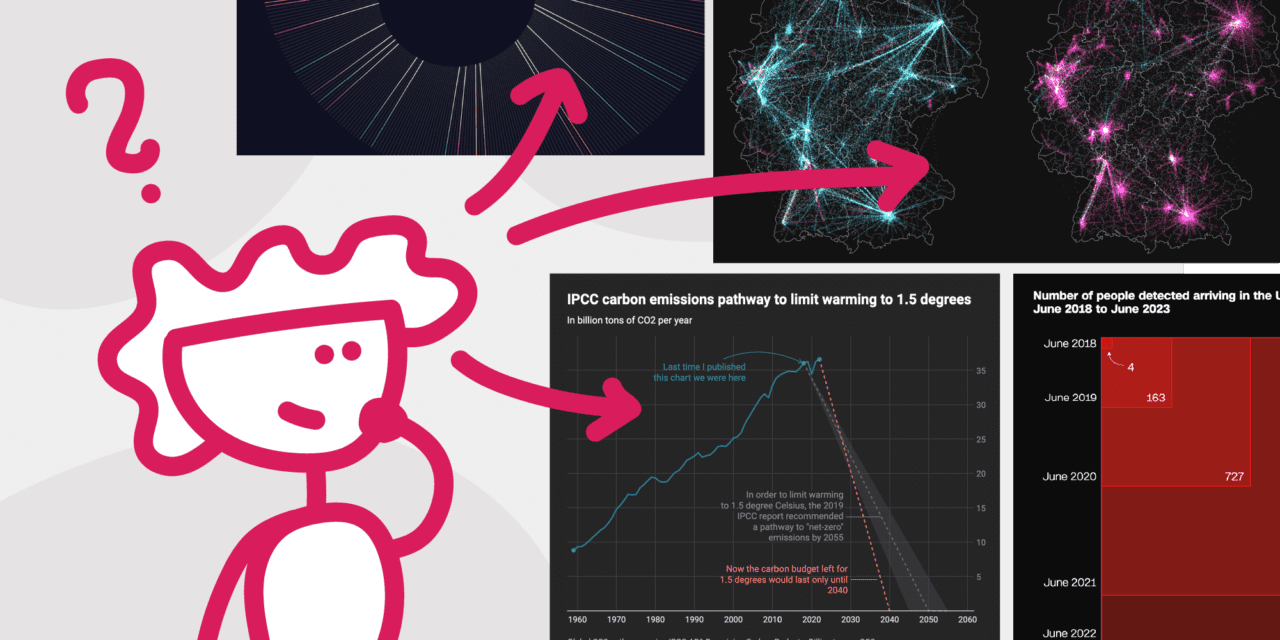
“How to get started with data visualization” by Lisa Charlotte Muth takes us on an exciting journey into data visualization and tells us why it’s important and even more important, how to get started. She suggests
- Find out what you like about data visualizations
- Don’t worry too much about data or tools
- Start to visualize data
Practice and experimentation are key to becoming proficient in data visualization. Start with simple visualizations and gradually explore more complex techniques as you become more comfortable with the tools and concepts. It plays a crucial role in making data more accessible and actionable across various domains.
This article will help empower designers to communicate complex information more effectively and should be read by all designers young and old alike.
Let us know what you think in the comments.


